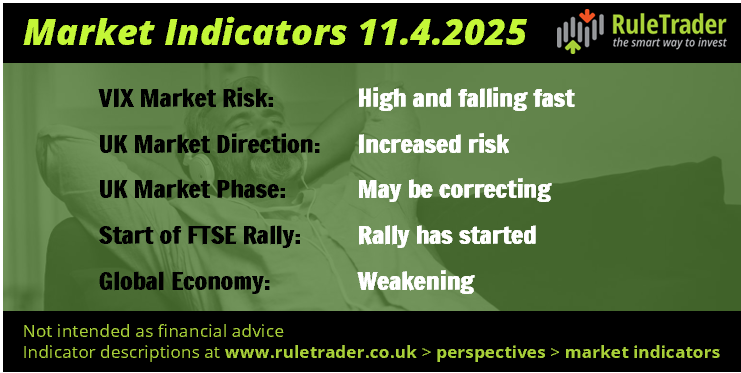
Market Indicators

Each of these indicators, which are described below, is updated daily using a RuleTrader Trading Specification. For a detailed explanation and 10-year back-test results for each indicator, just click on the indicator name:
- Market Risk: Tracks the level and daily rate of change of the VIX index as a proxy for market risk and the direction that risk is moving in
- UK Market Direction: Identifies the level of opportunity / risk in the UK market by comparing the direction and rate of change of the FTSE Small Cap and FTSE 350 indexes. This takes advantage of the fact that Small Caps suffer first when risk builds and emerge first when risk recedes and opportunity beckons.
- UK Market Phase: This uses RuleTrader’s AutoTrend system to track medium and long term trends, along with RuleTrader’s unique Top/Bottom Detector. The indicator uses these with various rolling averages to indicate when rallies in the FTSE All-Share may have peaked and it also tries to identify imminent or actual market corrections and/or bear markets.
- Start of Rally: This indicator calculates volume-weighted market breadth for rising and falling shares on the FTSE All-Share to indicate when a significant rally is likely to have started. When a major rally starts there will be a rush to benefit, which will cause a large swing from sellers to buyers. This is reflected in the volume of shares whose price is being driven up by purchasers, relative to those whose price is being driven down by sellers.
- Global Economy: Uses the ratios of copper and oil to gold, and short term to long term gilt yields to signal the strength of the global economy. Copper and oil prices tend to rise relative to gold in a strong economy, while the opposite occurs as the economy weakens. Similarly, ‘yield inversion’ is a well known indicator of a possible recession starting.
